Boards and commission meetings

Third-party escrow service available in Colorado
July 15, 2025
Garfield County is offering property owners a new option to pay property taxes in monthly installments through escrowtaxes.com. The secure...
More info
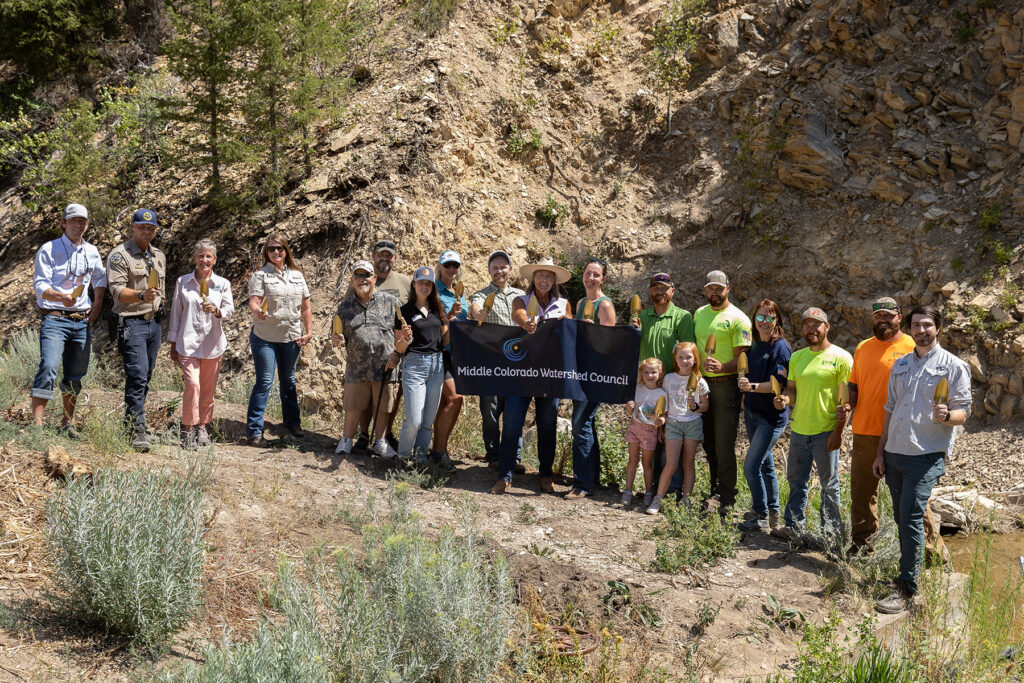
Roan Creek fish barrier project groundbreaking
August 6, 2025
The Middle Colorado Watershed Council (MCWC), in partnership with Garfield County and state and federal funders, broke ground on the...
More info
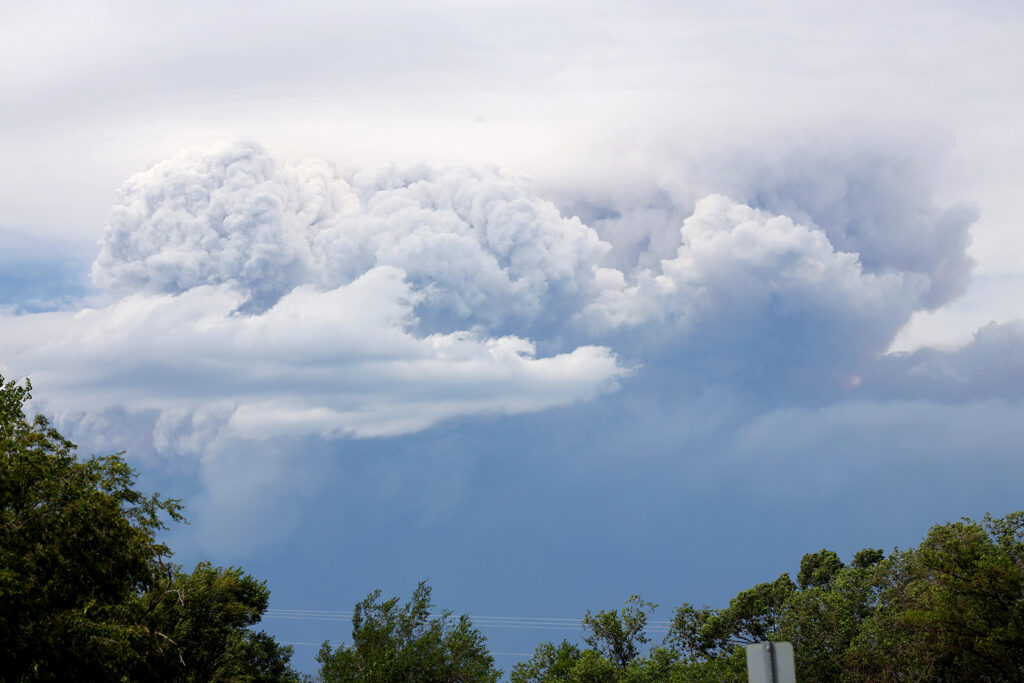
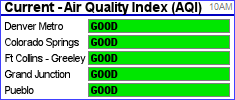
Wildfire smoke from the Lee Fire impacts Garfield County
August 9, 2025
The Lee Fire is producing smoke that is affecting air quality in Garfield County. Visit AirNow to determine if it’s...
More info
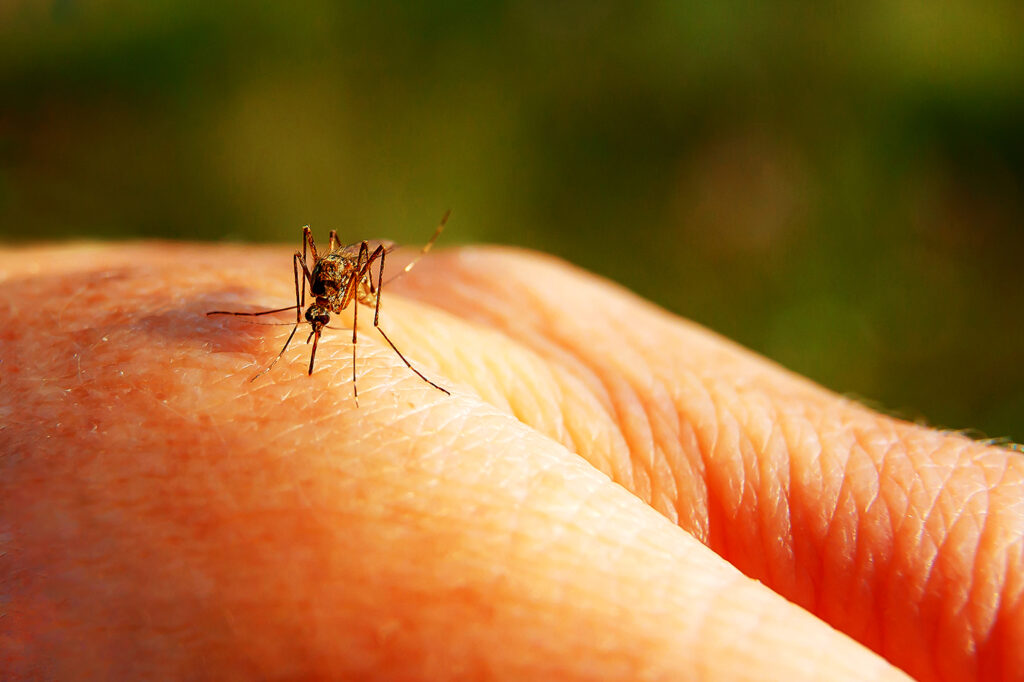
West Nile virus detected in Garfield County mosquitoes
August 6, 2025
Garfield County, especially the areas around Silt, Rifle, Battlement Mesa, and Parachute, is home to a type of mosquito that...
More info

Garfield County weighs in on methane rulemaking
July 17, 2025
Garfield County is participating in discussions surrounding proposed state greenhouse gas reporting requirements that could force municipal solid waste landfills...
More info
Garfield County implements temporary hiring freeze
July 22, 2025
Garfield County has adopted a temporary hiring freeze effective July 21, 2025, for all advertised administrative positions. The freeze is...
More info
Garfield County emergency alerts