Boards and commission meetings
NEWS

ProRodeo rides into Rifle
The Professional Rodeo Cowboys Association (PRCA) and the Woman’s Pro Rodeo Association (WPRA) return to Rifle with the ProRodeo competition. Not for the faint of heart, these cowboys and cowgirls display their strength, skill, and grit under the lights of the arena. Events include bareback riding, saddle bronc riding, bull riding, steer wrestling, team roping, tie-down roping, and barrel racing.
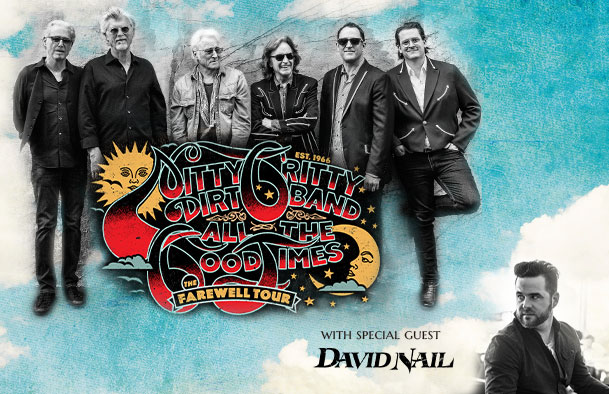
Good times with the Nitty Gritty Dirt Band
The three-time GRAMMY Award-winning Nitty Gritty Dirt Band brings the All the Good Times: The Farewell Tour to the Garfield County Fair and Rodeo on Friday, August 8. Country music star David Nail gets things warmed up at the Garfield County Fairgrounds. With strong ties to the Western Slope and the Roaring Fork Valley, the band’s Rifle stop on the farewell tour takes its storied career full circle. Come on out to the Garfield County Fairgrounds for an amazing evening of music on Aug. 8.
Tickets are on sale now at garfieldcountyfair.com.

Third-party escrow service available in Colorado
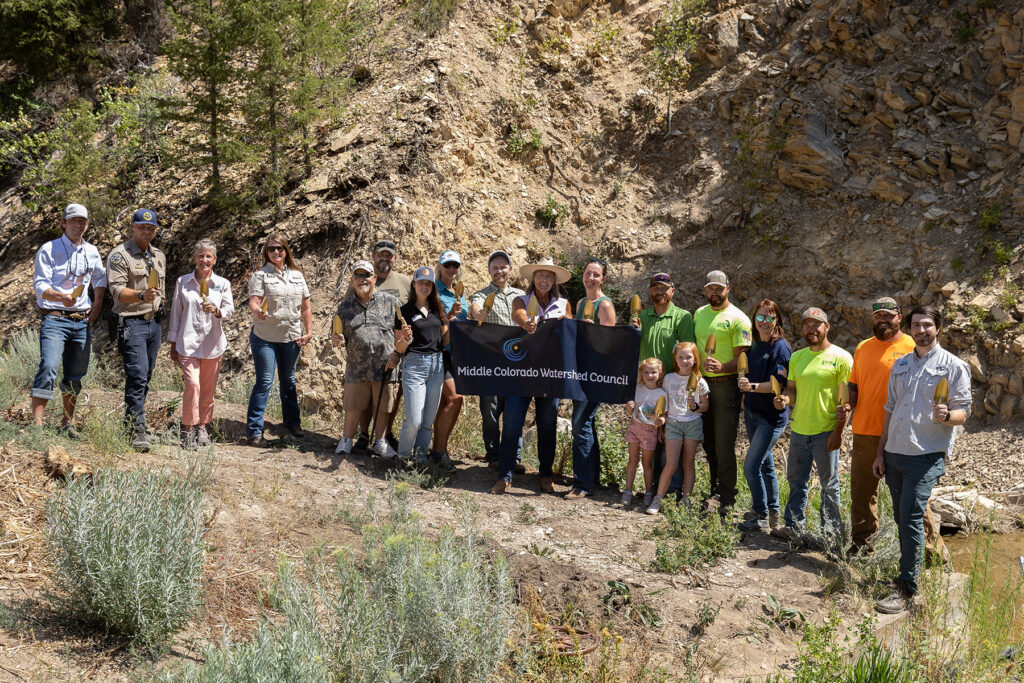
Roan Creek fish barrier project groundbreaking

Garfield County enacts fireworks prohibition
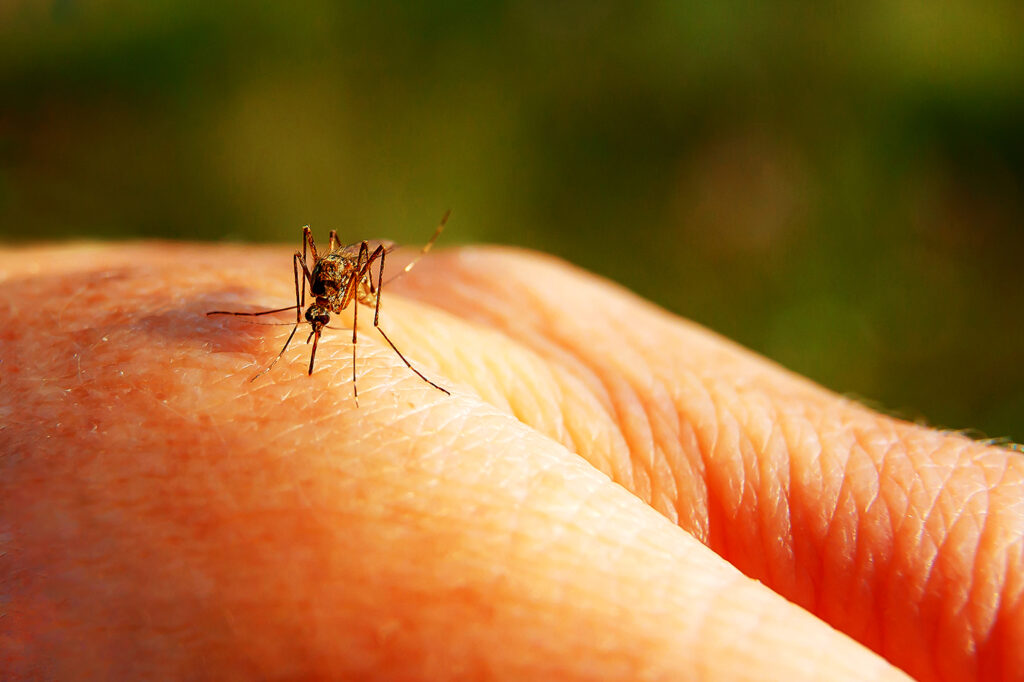
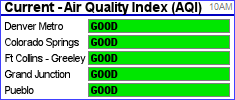
West Nile virus detected in Garfield County mosquitoes

Garfield County weighs in on methane rulemaking
Garfield County implements temporary hiring freeze
Garfield County emergency alerts