Boards and commission meetings
Current Month
NEWS
We are home!
Garfield County has completed its domain name shift to garfieldcountyco.gov. The .gov domain is only available to U.S.-based governmental organizations, such as federal, state, and municipal governments, as well as police and fire departments, and sheriff’s offices. The move to .gov reassures customers that they are on the correct website and haven’t clicked to a fraudulent site. More information about the benefits of a .gov website are available on the county’s gov address page.

How to avoid the risk of rabies from bats
May 27, 2025
Bats are rarely aggressive and don’t commonly have rabies. However, it is always important to know what you need to...
More info
Colorado DMV Issues Urgent Warning on New Text Scam
June 5, 2025
DMV scam warning If you receive a suspicious text message claiming to be from the DMV: Do NOT click on...
More info
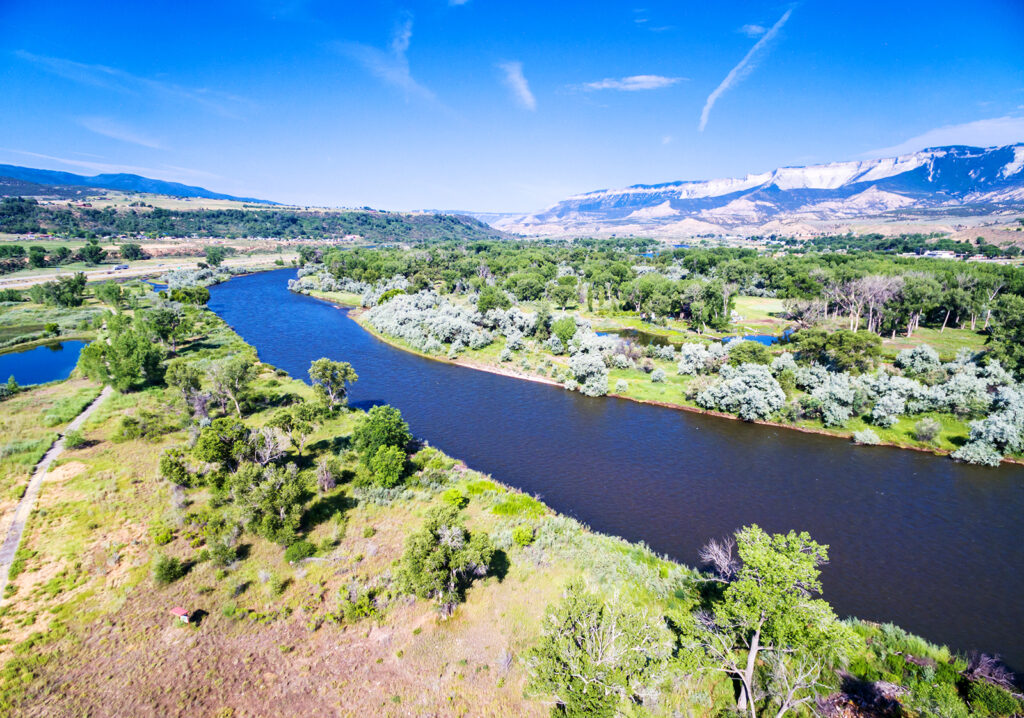
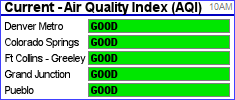
Data shows good air quality in Garfield County
May 22, 2025
A review of local monitoring data shows that Garfield County is home to clean air with air quality trends heading...
More info
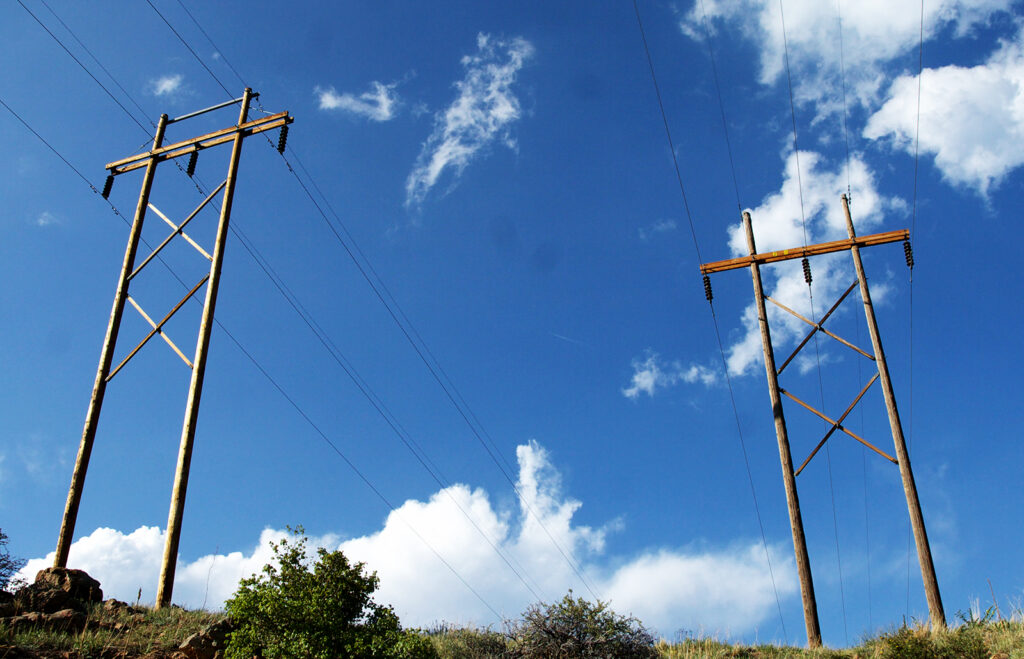
New Xcel Energy transmission line work spans Rifle to De Beque
May 21, 2025
Xcel Energy is building a better, cleaner energy future by taking steps to create a smarter and stronger energy grid,...
More info

Triple fatality accident near New Castle
May 28, 2025
UPDATE - May 29, 2025 Triple fatality involving two vehicles, Interstate 70, mile marker 105.9 Westbound, New Castle, CO. Identity...
More info
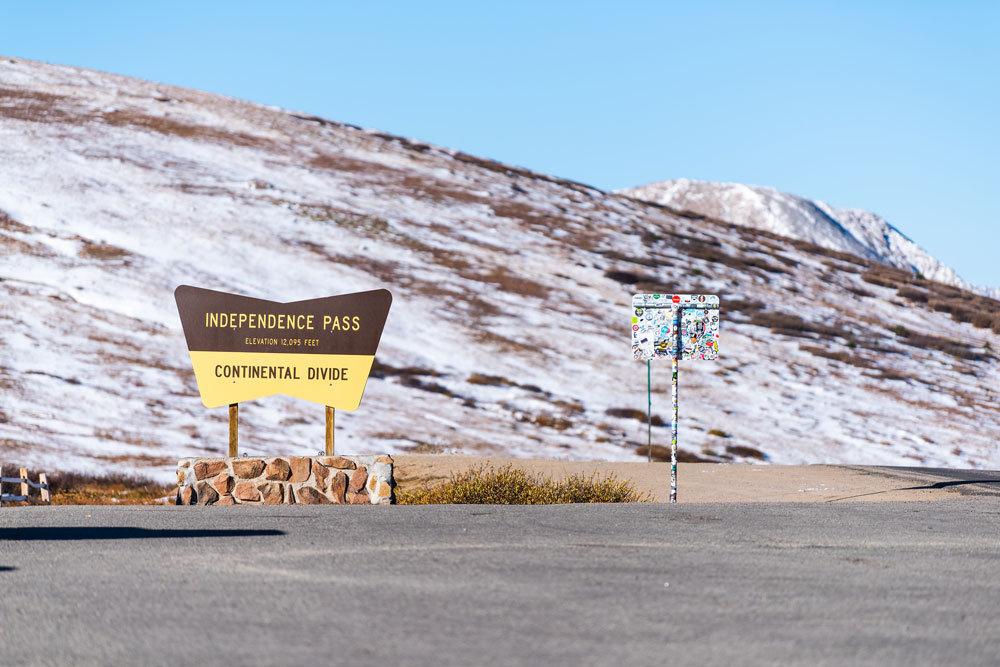
CDOT opens Independence Pass for the 2025 season
May 23, 2025
Crews with the Colorado Department of Transportation have reopened Independence Pass on Colorado Highway 82 for the season. Workers unlocked...
More info
Garfield County emergency alerts